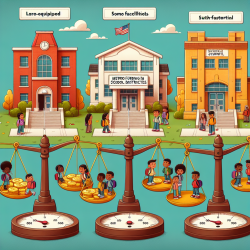
Bold action on multiple fronts is needed to ease local revenue disparities between wealthy and less wealthy districts in neighboring communities, a recent Bellwether report suggests. Specifically, the report recommends updating state funding formulas so weighted student-based funding approaches include a sufficient base amount per student, as well as generous additional allocations for students in poverty and those needing learning interventions. At the local level, leaders should discuss and advance solutions that reduce disparities, the report says. Some of those solutions may include:
- District consolidations
- Caps on the local revenue districts can raise above the state formula amount
- Policies that ensure districts that levy similar tax rates can generate similar levels of per-pupil revenue through added or matching state revenue
The Bellwether research analyzed education funding inequities within 123 large metro areas in 38 states and was particularly focused on funding disparities among districts in the same region. The study found wealthy districts often generate much more local funding per student than less affluent districts because of economic segregation. Also evident were big differences in taxable property wealth that allow richer districts to raise revenue more easily compared to less affluent districts with lower tax rates. Southwest Connecticut, for example, has highly affluent communities along with some pockets of highly concentrated poverty. There, the most wealthy districts — as calculated through median household income and median property value — spend $28,899 per pupil in average state and local revenue. But in the area's less wealthy districts, the combined state and local revenue averages to $17,351 per pupil. "One thing is crystal clear: If the policy status quo persists, so, too, will the disproportionate advantages for affluent communities in many states' public school systems,†the report said. Here are more figures from the Bellwether study:
BY THE NUMBERS
- 62% - The percentage of public school students who live in large metro areas with more than five districts — a fragmentation that's more conducive to funding disparities.
- $26 billion - The amount needed in additional state funding per year to close the state and local funding gap among districts within the metro areas examined.
- 72% - The percentage of students attending traditional public school districts who live within a large metro area with at least 50,000 public school students.
- 4.8 million - The number of students enrolled in 756 metro-area school districts Bellwether classified as "economic elite†due to higher income levels and property wealth.
- 19.4 million - The number of students who attend 2,837 metro-area school districts classified as "middle class majority.â€
- 3.6 million - The number of students who attend 545 metro-area districts labeled as "opportunity outsider†because of lower income levels and property wealth.
- $15,107 - The average per-pupil state and local revenue for opportunity outsider districts in the Philadelphia metro area. In comparison, economic elite districts in the area have an average per-pupil state and local revenue of $21,402.
- $232 - The difference in average per-pupil state and local revenue between the Houston metro area's economic elite ($11,493) and opportunity outsider districts ($11,725). A narrower local revenue gap is the result of incentives that constrain local property tax generation, which allows state revenue to reduce funding disparities between these districts, Bellwether said.
For more information, please follow this
link.


