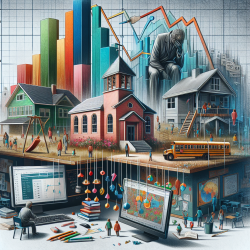
School leaders have been feeling it for a while: smaller class rosters, shifting attendance patterns, and a growing sense that “something changed” after COVID-19. Now, new research from The Hamilton Project at Brookings by Eloise Burtis and Sofoklis Goulas helps quantify what districts are experiencing—and why the impact is not evenly distributed.
For schools, enrollment is not just a headcount. It shapes staffing, funding, programming, and the ability to provide consistent student supports. For special education teams and related service providers, enrollment shifts can create a confusing paradox: fewer students on paper, but greater intensity of needs among the students who remain. Understanding the national pattern can help districts plan more responsibly—and more equitably.
What the research found: the enrollment drop is real, widespread, and uneven
The paper investigates how public school enrollment changed after the COVID-19 pandemic, using a combination of U.S. Census Bureau estimates of school-age children and the National Center for Education Statistics’ Common Core of Data (CCD) enrollment counts. This matters because it helps separate two different forces:
Demographic change (fewer school-age children in a community)
Schooling decisions (families choosing options outside traditional public schools)
One of the most striking findings is how many schools experienced unusually large enrollment losses during the pandemic period compared to the years just before it.
Between the 2018–19 and 2021–22 school years, about 12% of public elementary schools and 9% of middle schools experienced more than a 20% decline in enrollment.
Before the pandemic, that level of decline was far less common: roughly 5% of elementary and middle schools saw a 20% decline between 2015–16 and 2018–19.
In other words, the “tail end” of severe enrollment loss got much bigger after COVID-19—suggesting the pandemic wasn’t just a temporary disruption. It shifted the entire distribution of enrollment change.
Where did students go?
The authors highlight a major change in the share of school-age children enrolled in traditional public schools (TPS). At the start of the pandemic (2019–20), roughly 84% of school-age children were enrolled in TPS. That fell to about 81% in 2020–21 and then to about 79% in 2021–22.
At the same time, the share of students who are effectively “outside” the public school system increased—students who may be in private schools, homeschooling, virtual options, or potentially out of school entirely.
From a special education lens, this is more than a data point. When students leave the public system, districts may lose visibility into whether students are receiving appropriate supports, whether learning gaps are widening, and whether families have access to related services like speech-language therapy or occupational therapy.
Elementary and middle schools took the biggest hit
The paper breaks enrollment patterns down by grade level, and the differences are important for planning.
Elementary schools saw the sharpest drop early, and then stabilization at a lower level.
Middle schools continued to decline later, suggesting a “wave” effect as smaller elementary cohorts move upward.
High schools saw comparatively limited change in median enrollment during 2019–20 through 2021–22.
Specifically, the median elementary school declined from 441 students (2019–20) to 411 (2020–21) and 413 (2021–22), a loss of roughly 6–7% compared to pre-pandemic levels. The median middle school declined from 511 (2019–20) to 494 (2020–21) and then 484 (2021–22), showing continued downward movement.
For district leaders, this has a practical implication: even if enrollment “stops falling” in elementary, middle schools may still be heading into several years of pressure as cohort sizes work their way through the system.
Urban and high-poverty districts saw the steepest declines
Enrollment declines were not evenly distributed. The analysis finds that urban districts and high-poverty districts experienced larger losses.
For example, the median urban elementary school’s enrollment decline grew from about 7.5% (2020–21 relative to 2019–20) to about 9% (2021–22 relative to 2019–20). In contrast, rural elementary schools showed the fastest recovery, regaining about three percentage points in the second year.
High-poverty districts (child poverty rate above 20%) also saw larger and more persistent declines than low- and middle-poverty districts. This is where the equity implications become unavoidable: the communities most likely to face staffing shortages, budget constraints, and service disruptions are often the same communities where students rely most heavily on school-based supports.
Why enrollment declines create operational and special education challenges
The paper outlines several ways declining enrollment can destabilize schools. These are especially relevant for special education and related services, where continuity and compliance matter.
Funding declines faster than costs. State and federal aid is often tied to student counts, but many costs (building operations, staffing structures, specialized programs) are fixed or slow to change.
Layoffs may not reflect effectiveness. When districts reduce staff, decisions are not always based on instructional impact—creating risk for service quality.
Organizational strain increases. Districts may be forced into resource reallocation, program consolidation, or even school closures.
Students experience disruption. School closures and staffing instability can create stress for families and interrupt learning and support plans.
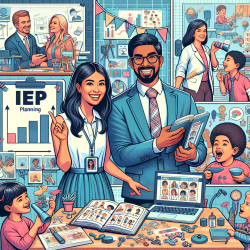
From a compliance standpoint, these pressures can show up as missed service minutes, difficulty staffing IEP-mandated services, and increased caseloads for remaining providers. From a student-centered standpoint, instability can reduce trust and engagement—especially for students who already need predictable routines and consistent relationships.
The rise of virtual options is not just a pandemic blip
Another key insight: virtual schooling expanded during the pandemic and remained elevated through 2021–22. The share of K–12 students enrolled in virtual public schools more than doubled from 0.5% (2015–16) to 1.1% (2021–22). Charter enrollment also rose steadily over the period.
Whether families moved for flexibility, health concerns, dissatisfaction, or better fit, the result is a more complex ecosystem. For districts, this means student supports must be more portable and more adaptable than before.
At TinyEYE, we see how this moment calls for service delivery models that can flex with enrollment shifts while still protecting quality and continuity. Online therapy can help districts:
Maintain service access when staffing is tight or geographically constrained
Reduce gaps caused by vacancies, leaves, or hard-to-fill specialist roles
Support students consistently across buildings, programs, or transitions
Stabilize related services in districts facing budget and enrollment volatility
What school leaders can do next
The paper emphasizes that these enrollment declines are not a one-size-fits-all problem. The drivers likely differ across communities, which means solutions must be local, data-informed, and equity-centered. A few practical next steps for district teams include:
Track enrollment by grade span and school type to anticipate downstream effects (especially the elementary-to-middle “wave”).
Audit service delivery capacity in high-need schools, especially urban and high-poverty campuses where declines may be steepest.
Plan staffing with stability in mind, protecting critical student supports even when budgets tighten.
Strengthen re-engagement systems to identify “missing” students and reduce chronic absenteeism and disconnection.
Use flexible service models (including teletherapy) to reduce vulnerability to vacancies and enrollment-driven budget shocks.
Most importantly, enrollment declines should not automatically translate into reduced support. In many districts, the students who remain in traditional public schools include a higher share of students with intensive academic, behavioral, communication, and mental health needs. Planning must reflect that reality.
For more information, please follow this link.