High school graduation rates are one of the most important “big picture” indicators of how well a school system is serving students—academically, socially, and emotionally. The 2015 Building a Grad Nation annual update (Civic Enterprises and the Everyone Graduates Center at Johns Hopkins University, with national partners) offers a hopeful headline and a clear warning at the same time: the nation is improving, but we are running out of time to close persistent gaps for students who have historically been underserved.
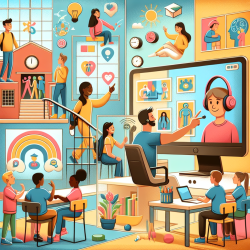
As a company that provides online therapy services to schools, TinyEYE pays close attention to the “why” behind graduation outcomes. Graduation is not just a high school issue; it’s a long-term outcome shaped by attendance, behavior, course success, mental health, disability supports, language access, and whether students feel connected to adults who notice when they’re struggling.
What the national numbers say (and why they matter)
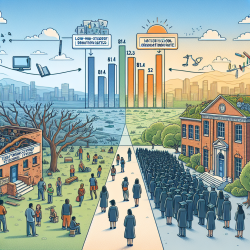
The report notes that in 2013 the national on-time high school graduation rate reached a record 81.4%. Even more encouraging, the country was on pace—again—for a 90% on-time graduation rate by the Class of 2020.
That progress is not accidental. The report emphasizes that graduation rates rose because many states, districts, and schools made focused, sustained changes—not because of broad demographic or economic trends. In other words, improvement is possible when systems decide it’s a priority and build the structures to support it.
The “drivers” behind graduation gains—and the gaps that remain
The report organizes the challenge into five major “drivers” that influence whether the nation can reach 90% graduation:
- Low-income students
- Minority students
- Students with disabilities (special education)
- Big cities/big districts
- Big states
These categories matter because they point schools and policymakers toward where targeted effort can have the biggest impact.
Driver 1: Low-income students—majority enrollment, persistent gap
One of the most urgent findings is that low-income students became the majority in U.S. public schools (as measured by eligibility for free and reduced-price lunch). Yet their graduation outcomes still lag significantly.
- The 2012–13 graduation rate for low-income students was 73.3%.
- The estimated graduation rate for non-low-income students was about 88.2%.
- That’s a gap of roughly 15 percentage points nationally.
The report reframes the achievement gap as an opportunity gap: differences in access to early learning, stable housing, food security, healthcare, mentoring, and high-quality instruction. From a special education and student-support perspective, this framing is essential because it shifts the question from “What’s wrong with students?” to “What supports are missing—and how do we build them?”
Driver 2: Minority students—gains are real, barriers are still structural
The report highlights meaningful progress for Hispanic/Latino and African American students:
- Hispanic/Latino graduation rates rose to 75.2% in 2013, up 4.2 points since 2011.
- African American graduation rates rose to 70.7% in 2013, up 3.7 points since 2011.
- White students were at 86.6% and Asian students at 88.7%.
These gains are tied, in part, to a decline in so-called “dropout factories”—high schools where graduation is not the norm. The report notes there were fewer than 1,200 such schools nationwide, with 1.5 million fewer students attending them compared to earlier years.
But the report is equally clear about ongoing barriers, including:
- Discipline disparities that remove students from learning time
- Language barriers and inconsistent supports for English Learners
- Unequal access to rigorous coursework (like Algebra II and chemistry) and to AP/advanced options
Driver 3: Students with disabilities—graduation is possible, but systems must change
Students with disabilities (SWD) are a central focus for anyone working in special education. The report states:
- The 2012–13 graduation rate for students with disabilities was 61.9%.
- That is nearly 20 points below the national average.
The report also points out a critical nuance: states vary widely in how they define and count SWD in graduation calculations and in what “regular diploma” requirements look like for students with IEPs. That makes cross-state comparisons tricky.
Still, the message is unmistakable: many students with disabilities can meet diploma requirements with the right supports, but they face obstacles such as:
- Low expectations and misperceptions about disability and ability
- Disproportionate discipline (including higher suspension rates for students with disabilities, especially Black and Hispanic/Latino students with disabilities)
- Confusing or limiting exit pathways that may reduce postsecondary options
From a school-services lens, this is where coordinated supports matter most: IEP implementation, executive functioning supports, behavior regulation, communication supports, counseling, and family-school collaboration.
Driver 4: Big districts—where national outcomes are decided
The report explains that 500 large districts (enrolling 15,000+ students) educate:
- 40% of all public school students
- 58% of the nation’s Black and Hispanic/Latino students
- 47% of low-income students
Some large districts made dramatic gains; others stagnated or lost ground. The takeaway is not “big districts can’t improve.” The takeaway is that improvement depends on leadership, infrastructure, data use, and sustained multi-sector support.
Driver 5: Big states—progress here determines progress nationally
More than half of U.S. public high school students live in just 10 states (including California, Texas, New York, and Florida). The report highlights how progress varies widely across these states—and how setbacks in a few large states can slow national momentum.
What schools can do that actually moves graduation rates
One of the most practical parts of the report is its emphasis on strategies that schools and districts can implement now. Several themes stand out for educators and student support teams.
1) Use Early Warning Systems (the “ABCs”)
The report underscores the power of monitoring:
- Attendance
- Behavior
- Course performance/credit accrual
These indicators help schools identify students who are drifting off track long before a dropout decision is made. But data only helps if there is an adult system to respond—teams, intervention menus, and time to follow up.
2) Rethink discipline so students stay connected to school
The report documents how suspensions and expulsions increased over decades and how they disproportionately impacted minority students and students with disabilities. It also highlights promising results from restorative justice approaches in districts like Oakland, where reductions in suspensions and improvements in attendance and dropout outcomes were reported.
From a special education perspective, this aligns with what we know: students who are already struggling with regulation, trauma, communication, or learning needs do not improve by being removed from instruction and relationships. They improve when adults teach skills, repair harm, and keep students engaged in learning.
3) Expand access to caring adults and integrated supports
The report repeatedly returns to the role of mentoring, counseling, tutoring, and coordinated services. Students who have consistent adult support show stronger academic and life outcomes. Yet many schools—especially high-poverty schools—are stretched thin.
This is a place where schools can strengthen capacity by combining in-person staff with specialized remote services. For example, online therapy can help districts address shortages and improve access to:
- Speech-language therapy
- Occupational therapy
- Mental health supports and counseling partnerships (where applicable)
- Consultation for educators and families
When these supports are aligned with the ABCs and embedded into school routines, they can reduce barriers that show up as chronic absence, behavior referrals, and course failure.
A clear bottom line for school leaders
The 2015 Building a Grad Nation report makes a strong case that graduation is a solvable problem—but only if schools and communities treat it as a whole-child, equity-centered effort. The nation’s progress to 81.4% is real. The remaining work is about closing gaps for low-income students, students of color, English Learners, and students with disabilities—through better data use, fairer discipline, rigorous opportunity, and reliable adult support.
For more information, please follow this link.